Stoplight Dashboards give you instant, visual health checks for your QA processes. By integrating real-time data from testing tools and pipelines, they show you key metrics at a glance, helping you spot issues early and track progress effortlessly. With customizable visualizations, you can quickly identify bottlenecks or regressions and make informed decisions fast. Keep exploring how these dashboards can streamline your QA workflow and improve your testing outcomes.
Key Takeaways
- Stoplight Dashboards provide real-time visual insights into QA metrics for quick health checks.
- They integrate seamlessly with testing tools and CI/CD pipelines for automatic data updates.
- Visual elements like charts and color codes help identify issues and trends instantly.
- The dashboards simplify monitoring multiple projects, reducing manual data management.
- They empower teams to prioritize and address QA concerns swiftly, ensuring high-quality releases.
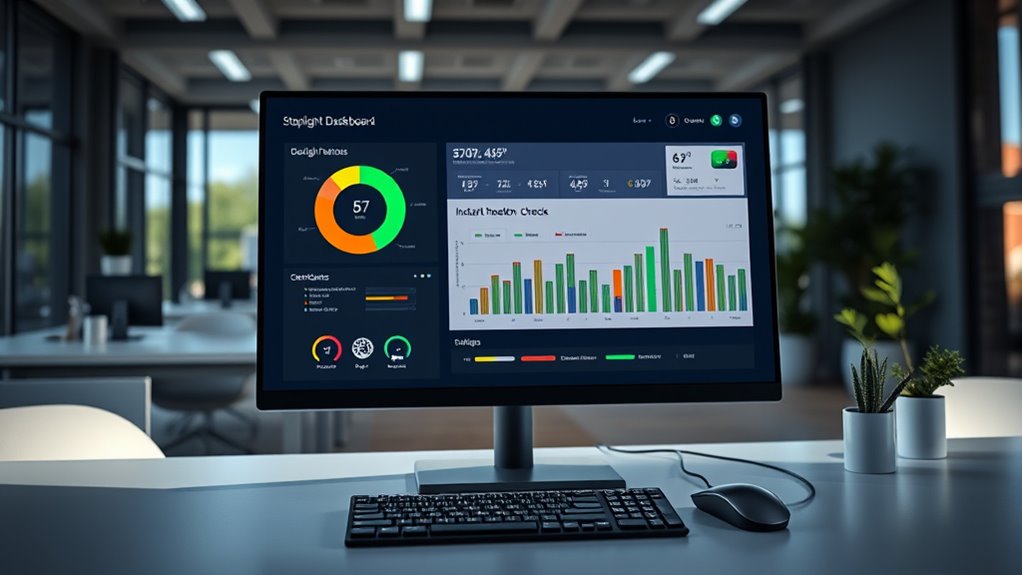
Stoplight dashboards offer a clear, visual way to monitor your key metrics at a glance. When you’re managing multiple projects or overseeing complex QA processes, having instant insight becomes vital. That’s where Stoplight dashboards shine—they centralize your data, making it easy to spot issues, track progress, and make informed decisions quickly. One of the biggest advantages is how seamlessly you can integrate these dashboards into your existing workflows through API integration. Whether you’re pulling in data from testing tools, CI/CD pipelines, or other development platforms, API integration ensures your dashboards stay up-to-date automatically. This real-time connectivity means you don’t waste time manually updating metrics or hunting down information; instead, you get a live, accurate view of your QA health at all times.
Data visualization plays an essential role here. Stoplight dashboards leverage powerful visual elements—charts, graphs, color-coded indicators—to turn raw data into intuitive insights. Instead of sifting through endless logs or spreadsheets, you see a clear picture of your testing status, coverage, and defect trends right on the dashboard. This immediate visual feedback helps you identify bottlenecks or regressions before they escalate, streamlining your QA process. Plus, with customizable visualizations, you can tailor the dashboard to highlight what matters most to your team, whether that’s test pass rates, API health, or code coverage metrics. Additionally, understanding the importance of contrast ratio and other display settings can improve the clarity of your data presentation on the dashboard.
The beauty of Stoplight dashboards is that they’re designed for ease of use, even if you’re not a data expert. The integration of APIs allows you to connect with a variety of tools, making data collection effortless. As your testing environment evolves, you can adjust your dashboard’s data sources or visualization styles without hassle. This flexibility means your dashboard can grow with your team’s needs, providing ongoing value without requiring extensive reconfiguration.
Furthermore, the visual nature of these dashboards reduces cognitive load. Instead of pouring over complex reports or logs, you get a snapshot of your QA health, enabling you to prioritize issues swiftly. If there’s a spike in failed tests or a drop in API performance, it’s immediately apparent. You can then drill down into specific metrics or logs directly from the dashboard, thanks to integrated data visualization capabilities. This combination of API integration and visual clarity empowers you to maintain high-quality standards and swiftly respond to issues, all from a single, easy-to-understand interface.
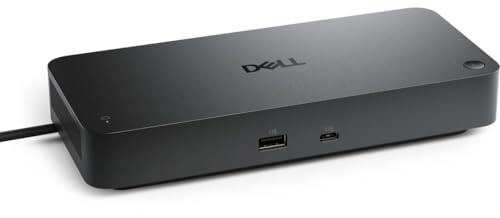
Dell Pro Thunderbolt 4 Smart Dock SD25TB4 – USB-C Station 130W, 4 Displays 4K, 2X DP 1.4, HDMI 2.1, 2X Thunderbolt 4, 2.5GbE, Wi-Fi, Sustainable Design
POWERFUL MULTIDISPLAY SUPPORT: Up to 4 4K monitors per HDMI 2.1, DP 1.4, USB-C and Thunderbolt 4 —...
As an affiliate, we earn on qualifying purchases.
Frequently Asked Questions
How Customizable Are Stoplight Dashboards for Different Teams?
You’ll find that dashboard customization offers great team flexibility, allowing you to tailor the display to your specific needs. You can easily modify metrics, layouts, and visual elements, making it adaptable for different team sizes and roles. This level of customization helps your team focus on what matters most, streamlining workflows and enhancing collaboration. Overall, it’s designed to be intuitive, empowering you to create dashboards that truly fit your team’s unique requirements.
Can Stoplight Dashboards Integrate With Existing Ci/Cd Pipelines?
You can definitely integrate Stoplight dashboards with your existing CI/CD pipelines. The platform offers strong API compatibility, making it easy to connect with your tools and automate health checks. Additionally, you can manage user permissions to guarantee that only authorized team members access sensitive data. This seamless integration helps you monitor your software’s health in real time, streamlining your development workflow and improving overall quality.
What Security Features Are Available for Sensitive QA Data?
You should consider security features like encryption protocols to protect sensitive QA data during transmission and storage. Access controls are essential, allowing you to restrict data access based on roles, ensuring only authorized personnel can view or modify the information. Combining these features helps maintain data confidentiality and integrity, giving you confidence that your sensitive QA data stays secure and compliant with industry standards.
How Often Are Dashboard Updates or Refreshes Performed?
Imagine you’re overseeing QA dashboards, and you wonder about their refresh intervals. Typically, dashboard frequency varies based on your needs—some refresh every minute, others hourly or daily. For example, a finance team might set real-time updates for critical metrics, ensuring quick responses. You should check your system’s settings to determine your refresh intervals, so you stay updated with the latest data, enabling timely decisions and efficient QA processes.
Is Training Required to Effectively Use Stoplight Dashboards?
You might wonder if training is necessary to use dashboards effectively. The learning curve varies depending on your familiarity with data tools, but some training greatly boosts user proficiency. With proper guidance, you’ll quickly understand dashboard features and interpret health checks accurately. While basic use can be intuitive, investing in training helps you leverage all functionalities, making your monitoring more efficient and insightful.
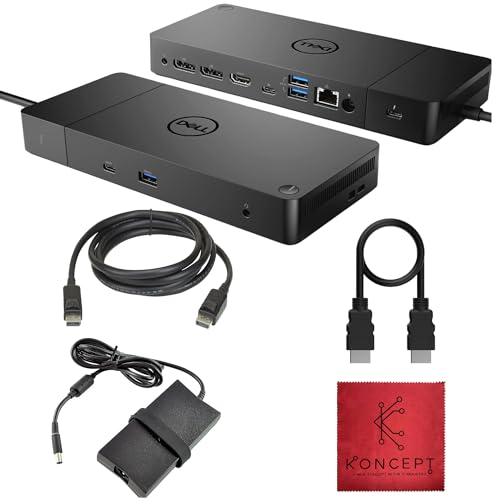
Dell WD19TB Thunderbolt Dock - 1 Year Warranty - Dell Docking Station Dual Monitor USB C with 180W, HDMI & DisplayPort Cable - Docking Station for Laptop & Computer (Renewed)
High-Energy Supplywith WD19TB] The included 180 supports universal V (120/230) and frequencies (50/60Hz), ensuring efficient and reliable energy...
As an affiliate, we earn on qualifying purchases.
Conclusion
With Stoplight Dashboards, you hold the heartbeat of your QA process right at your fingertips. They’re your lighthouse guiding you through turbulent waters, illuminating issues before they grow dark. As you navigate the seas of development, these dashboards keep your ship on course, ensuring smooth sailing. Embrace this instant health check, and turn chaos into clarity—your pathway to seamless, confident releases flows brighter with every glance. Let Stoplight be your steady compass in the journey ahead.
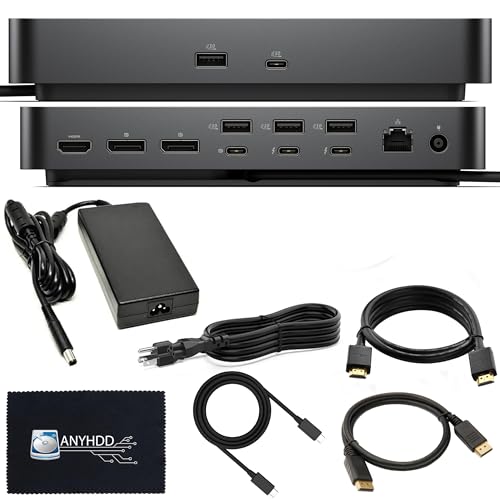
Dell SD25TB4 Pro Thunderbolt 4 Smart Dock - Supports 8k Display, 3 Years Warranty with 180W Adapter, HDMI, DisplayPort, Thunderbolt Cable, Cloth - USB C Docking Station Hub with Accessories
Modular Dell Dock Design - Upgrade Your dell docking station effortlessly with dell thunderbolt dock SD25TB4 swappable module...
As an affiliate, we earn on qualifying purchases.
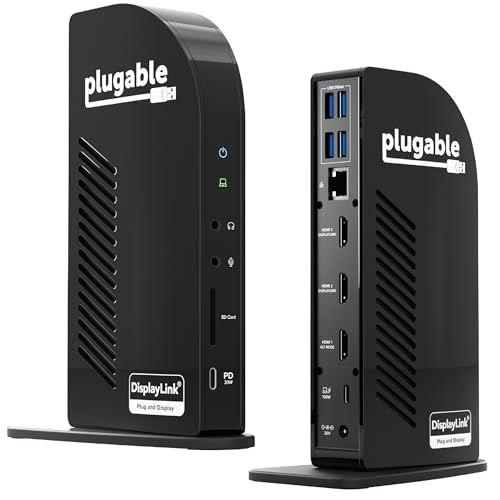
Plugable USB-C Triple Monitor Docking Station: 13-in-1 Laptop Dock with 100W Charging for Mac (DisplayLink Driver Required), Windows, Chrome, 3 HDMI, Gigabit Ethernet, SD, USB-C 20W, 4 USB - UD-ULTCDL
13-in-1 Laptop Docking Station: Expand your workspace with a powerful USB-C docking station featuring 13 essential ports. This...
As an affiliate, we earn on qualifying purchases.


