

📊 Full opportunity report: Bitcoin Battles Unfold in Live Warzone Visualization on ThorstenMeyerAI.com — validation score, market gap, and execution plan.
TL;DR
A new web-based project visualizes Bitcoin trading as a live warzone, depicting market activity as a cinematic battlefield. It connects directly to Binance and Coinbase streams, providing an artistic view of market chaos. The tool is not for trading but for visualizing data creatively.
Isbitcoindead.com has launched a groundbreaking live visualization of Bitcoin trading activity, transforming market data into a cinematic battlefield. The project connects directly to Binance and Coinbase streams, offering viewers a dynamic, real-time depiction of the ongoing tug-of-war between buyers and sellers. This innovative tool emphasizes visual storytelling over trading utility, making it a notable example of web technology in data visualization.
The visualization is built entirely with browser technology, utilizing Canvas 2D graphics, WebAudio synthesis, and WebSocket streams, with no backend infrastructure. It displays market activity as a combat scene where buy orders from the Cobalt Host push the front line from the left, while sell orders from the Ember Legion counter from the right. Large liquidations are visualized as airstrikes, adding visceral impact to the scene.
Data streams are sourced directly from Binance, with a fallback to Coinbase, ensuring continuous updates. The system features an automatic camera that shifts perspectives, from broad views to detailed skirmishes, and a live DEFCON meter indicating market volatility. The scrolling war log narrates ongoing market activity, while a synthesized soundtrack amplifies the tension. A comprehensive scoreboard tracks seconds won, casualties, and dollar gains, creating a narrative of market chaos. Importantly, the project emphasizes that it is not a trading tool, with a footer explicitly stating, ‘a live reading of the BTC/USDT tape · no advice, only war.’
Implications of Artistic Market Visualization
This project demonstrates how advanced web technologies can be harnessed for creative data visualization, offering an immersive, artistic perspective on market activity. It highlights the potential for visual storytelling in financial data, making complex market dynamics accessible and engaging for a broader audience. While not a trading platform, it emphasizes the chaos and intensity inherent in Bitcoin markets, which could influence how traders, enthusiasts, and educators perceive market fluctuations and volatility.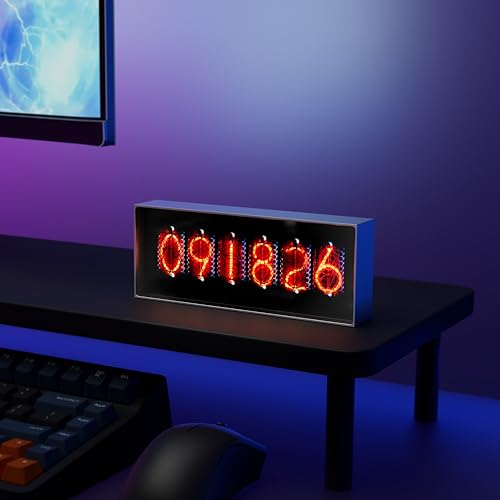
Electronic Display for Real-Time Cryptocurrency/Bitcoin/Stock Market Data, Time, Weather & Temperature, 164*28*65mm, Supports Image Upload and 30s Video Playback, App-Controlled, 960*360 Resolution
- Real-Time Data Display: Displays live cryptocurrency, stock, weather, and time
- Custom Media Uploads: Supports personalized images and 30s videos
- App-Controlled Management: Manage content and display via dedicated app
As an affiliate, we earn on qualifying purchases.
As an affiliate, we earn on qualifying purchases.
Web Tech Meets Market Data in Innovative Display
The visualization builds on recent advances in browser-based graphics and real-time data streaming. It follows a trend of using artistic tools to depict financial markets, but stands out for its cinematic battlefield theme. The project was launched recently by isbitcoindead.com, showcasing the potential for web tech to create immersive data experiences without requiring server-side infrastructure. It aligns with ongoing efforts to make complex market data more accessible and visually compelling, especially for tech-savvy audiences interested in Bitcoin’s volatility.“This visualization offers a visceral, artistic perspective on Bitcoin trading activity, emphasizing the chaos and intensity of the market.”
— an anonymous researcher

THE CRYPTO & DEFI BIBLE: The Ultimate High-Performance Operational Roadmap & Risk Ledger – Institutional-Grade Technical Dashboard for Digital Assets
As an affiliate, we earn on qualifying purchases.
As an affiliate, we earn on qualifying purchases.
Unconfirmed Aspects of the Visualization Project
It is not yet clear whether the project has plans for further development or integration with trading platforms. The long-term impact on market perception or trading behavior remains unverified, as the tool is explicitly non-trading and artistic in purpose. Additionally, the accuracy and representativeness of the visualization in reflecting actual market sentiment are still to be evaluated by users and experts.
CryptoTicr Bitcoin Ticker – Real-Time Crypto Price Display (1.54" Diagonal) for Top 1,000 Coins Like Bitcoin, Ethereum, Dogecoin, and 997 more. Compact Size, Ideal for Desk or Nightstand. Uses Wi-Fi.
- Creator Location: USA-based creator with support
- Warranty: Includes two-year warranty
- Real-Time Prices: Displays live prices for top 1,000 coins
As an affiliate, we earn on qualifying purchases.
As an affiliate, we earn on qualifying purchases.
Next Steps for the Bitcoin War Visualization
Developers may expand the visualization’s features, potentially adding more detailed analytics or user interaction options. Monitoring the project’s reception among traders and educators will be crucial to understanding its influence. Future updates might also include enhanced realism or integration with educational platforms to demonstrate market dynamics visually. The creators have indicated ongoing interest in refining the experience and exploring new artistic representations of financial data.
web-based financial data visualization tools
As an affiliate, we earn on qualifying purchases.
As an affiliate, we earn on qualifying purchases.
Key Questions
Is this visualization a tool for trading Bitcoin?
No, it is not designed for trading or financial advice. The project focuses solely on artistic, data-driven visualization of market activity.
How does the visualization work technically?
It uses browser-based technologies such as Canvas 2D graphics, WebAudio synthesis, and WebSocket streams to render real-time market data as a cinematic battlefield, without any server-side infrastructure.
Can I customize or interact with the visualization?
Currently, the visualization is designed as a passive display. Future updates may include interactive features, but the current version emphasizes immersive viewing.
What data sources does it use?
The visualization connects directly to Binance’s public trade stream, with a fallback to Coinbase, ensuring continuous real-time updates.
Why is it called ‘Bitcoin War’?
The name reflects the visual metaphor of market activity as a battlefield, illustrating the ongoing struggle between buyers and sellers in Bitcoin trading.
Source: ThorstenMeyerAI.com