
🔍 Read the full analysis: The Twilight Dial At Work In An AI Noctilucent Cloud Watch on ThorstenMeyerAI.com

Get business pricing on monitors, keyboards and dev gear
- Business-only prices and quantity discounts
- Tax-exempt purchasing
- Multiple users, one account, clear invoices
TL;DR
ThorstenMeyerAI.com describes “Noctilucent — NLC Watch at 83 km,” an AI-built exhibition piece, not a real observing project or scientific service. Its central feature is a solar-depression dial that changes the page’s simulated twilight and cloud lighting to illustrate how high-altitude noctilucent clouds can remain sunlit after the ground is dark.
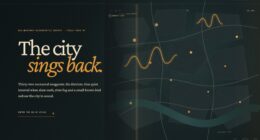
ThorstenMeyerAI.com describes an AI-built exhibition called “Noctilucent — NLC Watch at 83 km,” a fictional field journal that uses an interactive solar-depression dial to show how real noctilucent clouds can catch sunlight after the ground has entered darkness, as detailed in the original analysis. The project is a designed web experience, not a live scientific service or an operating observing network.
The dial spans the sun’s position from 6 to 16 degrees below the horizon, with the experience’s most expressive lighting near 11 degrees. As visitors move it, the page adjusts a set of linked visual elements, including sky brightness, shadow depth, cloud glow, ambient color, grain and horizon flare. The same simulated lighting state also informs diagrams and explanatory text.
The page’s sky and cloud visuals are generated in the browser rather than supplied as image files. According to the design account, Canvas produces the twilight gradient, stars and layered wave paths, while inline SVG provides geometric diagrams and an altitude illustration. Billowing, whirling and banded clouds are rendered with different wave patterns. A later interaction asks visitors to hold a control as simulated ground haze recedes and a cloud band at 83 kilometres becomes clearer; releasing it early lets the sighting fade.
The exhibition’s editorial sequence runs from the luminous horizon through cloud forms and ice crystals to seasonal observation and a field log. Its visual palette contrasts electric cyan, used for illuminated ice, with violet and near-black for the night sky; a cream section evokes a paper logbook. The source says animation pauses when the document is hidden, offscreen scenes are not continually painted, and reduced-motion settings receive a still version.
Interactive exhibition · Fictional field journal
The Twilight Dial At Work In An AI Noctilucent Cloud Watch
One movable sun angle turns a scientific idea into a visual journey: the ground darkens while ice clouds high above can still catch sunlight. The experience is an AI-built exhibition, not a live observing service.
One dial, a linked sky
Changing solar depression updates a group of visual cues together, so the visitor can connect a setting with the atmosphere it represents.
Move through twilight
The marker represents the sun’s position below the horizon. The illustration is a conceptual view of the page control.
From horizon to field log
The exhibition’s editorial path connects atmosphere, cloud structure, ice and seasonal context, then invites a patient look at a simulated sighting.
Graphics generated in the browser
The design account describes a visual system assembled from browser drawing techniques rather than photographs of observed clouds.
Atmosphere in motion
Canvas draws the twilight gradient, stars and layered wave paths. Different wave patterns suggest billowing, whirling and banded cloud forms.
Geometry made legible
Geometric diagrams and an altitude illustration explain the relationship between the observer, the horizon and the high cloud layer.
Exhibition palette: night to illuminated ice
Patience becomes an interaction
A hold-to-reveal exercise makes waiting part of the lesson: simulated haze recedes, bringing the high cloud band into clearer view.
Ground haze recedes
Keep the control pressed as the simulated lower atmosphere clears.
The 83 km band emerges
The cloud layer becomes more distinct within the designed scene.
The sighting fades
Ending the hold early lets the simulated view recede again.
“A sky that responds to the sun you cannot see”
ThorstenMeyerAI.com · describing the exhibition
Read the simulation clearly
The source describes an explanatory web experience. Its interface and invented field notes should not be mistaken for an operational observing network.
Is NLC Watch a real scientific service?
No. It is described as a fictional field journal for a fictional observing project. The clouds are real; the service is not presented as live.
What does the dial change?
It varies simulated illumination from 6° to 16° below the horizon, affecting sky light, cloud glow, shadow, ambient color and related diagrams.
Are the clouds photographs?
No. The account says the browser generates the visuals with Canvas, inline SVG and CSS. They are illustrations, not observed cloud photographs.
Does it report real sightings?
The supplied description mentions invented station logs. It does not say the page collects or reports real observations.
Has the lighting model been validated?
No scientific review or validation against observations is supplied. Treat the dial as an explanatory simulation, not a forecast or measuring tool.
What accessibility behavior is described?
The account says animation pauses when the page is hidden, offscreen scenes are not continually painted, and reduced-motion settings receive a still version. It provides no test results.
A Dial That Explains Twilight Geometry
The design’s central idea is to make one control explain a real optical contrast rather than merely decorate a page. Visitors can see the simulated ground-level twilight change while the higher cloud layer remains illuminated, making the relationship between the sun’s position and visibility easier to explore than a static illustration might.
That approach matters as an example of how an interactive interface can communicate science: the dial links a visible effect to a stated variable, and the hold-to-reveal exercise makes patience part of the lesson. But the account describes a creative presentation, not evidence that the model is scientifically validated, that it predicts sightings, or that the page collects observations. Readers should treat its visuals as an explanatory simulation, not a forecast or measurement tool.
interactive twilight dial for astronomy
As an affiliate, we earn on qualifying purchases.
As an affiliate, we earn on qualifying purchases.
Real Clouds, Fictional Field Journal
Noctilucent clouds are real, high-altitude ice clouds that can remain sunlit when the lower sky and observer are in darkness. The source places the exhibition’s cloud band at about 83 kilometres and frames the experience around the contrast between a darkening lower atmosphere and sunlight reaching ice higher above Earth.
The project brief calls the observing network fictional while drawing on real mesospheric science. It proposes seasonal observation content, including a solstice period and latitudes around 55 to 65 degrees, as well as invented station logs associated with locations near Kiruna and the Shetland Islands. Those details belong to the designed scenario; they do not establish that observers at those stations made real sightings.
ThorstenMeyerAI.com says the work was developed in three passes: building the page, reviewing it for clarity and interaction, then conducting an art-direction review. A construction guide is also referenced, with implementation notes on the lighting model, generated graphics and animation behavior. The supplied material does not give a publication date or independent evaluation of the finished experience.
“A sky that responds to the sun you cannot see”
— ThorstenMeyerAI.com, describing the exhibition
cloud visualization tools for sky watching
As an affiliate, we earn on qualifying purchases.
As an affiliate, we earn on qualifying purchases.
What the Simulation Does Not Establish
The source does not identify an external scientific review, provide measurements validating the page’s lighting model, or describe comparisons with observational data. It also does not say that the exhibition records real sightings or receives live atmospheric information. The dial’s displayed effects should therefore be understood as part of a designed experience, not a verified account of conditions in the sky at a particular time.
The source material provides no publication date, visitor figures, performance tests or independent assessment of accessibility. It describes intended behavior—including reduced-motion handling and pausing animation when a tab is hidden—but does not provide test results. The status of the referenced live page and design guide cannot be confirmed from the supplied account alone.
AI-powered sky simulation software
As an affiliate, we earn on qualifying purchases.
As an affiliate, we earn on qualifying purchases.
The Page and Its Build Notes
ThorstenMeyerAI.com points readers to the exhibition page and a construction guide explaining its implementation. The account does not announce a launch date for a scientific project, a schedule for new observations or a next research milestone. Any further development described should be read as work on the web exhibition unless its creators provide evidence of a separate observing service.
For readers interested in the project’s claims, the practical next step is to inspect the live page and its design guide, if available, and distinguish the interface’s generated visuals from real observations. The supplied source does not say whether scientific reviewers or observers have assessed the experience.
As an affiliate, we earn on qualifying purchases.
Key Questions
Is NLC Watch a real scientific observing service?
No. ThorstenMeyerAI.com describes it as a fictional field journal for a fictional observing project. The clouds it discusses are real, but the source does not describe a live scientific service.
What does the solar-depression dial do?
It changes the page’s simulated illumination across a range from 6 to 16 degrees below the horizon. That setting affects elements such as sky light, cloud glow, shadow and diagrams.
Are the cloud images photographs?
The source says the visuals are generated in the browser with Canvas, inline SVG and CSS, and that no image assets are used. They are illustrations, not photographs of observed clouds.
Does the page report real cloud sightings?
The supplied account describes invented station logs and a fictional observing project. It does not say the page collects or reports real sightings.
Has the lighting model been scientifically validated?
The source does not provide a scientific review or validation against observations. The dial is presented as an interactive explanatory simulation, not a validated forecasting or measurement tool.
Source: ThorstenMeyerAI.com
Halloween Picks
halloween
As an affiliate, we earn on qualifying purchases.